The Hydrologic Cycle

Globally, 60-70% of water is used in food production.
By 2030, 1 in 5 developing countries will face water shortages.


Watersheds
Area of Land where all of the water drains into the same place.
Defines the Control Volume in a System.
Highest Point: Divide
Lowest Point: Basin Outlet

The change in the amount of water stored in the watershed (dS) with respect to a given time interval (dt or ∆t) is equal to precipitation plus groundwater inflows minus discharge minus evapotranspiration minus groundwater outflows: dS/dt = P + Gin - (Q+ ET+ Gout)
Notes:
Groundwater flows (i.e., groundwater inflow and groundwater outflow) and discharge are measured as a volume per unit time (e.g., cubic feet per second or cubic meters per second). Precipitation and evaporation are often measured as a depth per unit time (e.g., inches per year or meter per day).
Oftentimes the volume of water is divided by the surface area of the region so the quantities have dimensions [L T-1].
When the inputs are equal to the outputs, we can say that the system is in steady state. What this means mathematically is that we can set the derivatives equal to zero and can rearrange the terms: P + Gin = Q+ ET+ Gout
The conservation equation would take the form: ΔS/Δt= mI – mQ
Where mI is equal to the average rate of input to the control volume over the time period Δt and mQ is equal to the average rate of output from the control volume over the time period, Δt.

Residence Time (Tr): The Average time that a given parcel of water spends in a reservoir.
Tr=S/mQ =S/mI
S= Mass or Volume
mQ= Average rate of outflow
mI: Average Rate of Inflow
Assumes mQ= mI

Incoming Solar Energy
Stefan-Boltzmann Law
All matter above absolute zero radiates energy (E): E=εσT^4
T is the temp of the surface [K], σ is the Stefan-Boltzmann constant (5.67 x 10 -8 W m^-2 T^-4), and ε is emissivity (dimensionless quantity that varies from 0 to 1).
The wavelength at which the maximum energy radiation occurs is given by Wien’s Law: Λmax = 2897/T and has units [μm].
The sun’s energy arriving at the surface is at wavelengths less than 4 μm (Shortwave Radiation). Earth emits longwave radiation. Sun emits shortwave radiation.


Gases within Earth’s atmosphere are capable of absorbing energy at specific wavelengths. Because gases are capable of absorbing energy at specific wavelengths, radiation striking the earth’s surface is depleted in certain wavelengths (e.g., 0.1-0.3 μm from the absorption of this wavelength range by ozone). Absorption of energy is also important because if gases in the atmosphere did not absorb radiation, our planetary temperature would be approximately 253 K.

The amount of incoming solar energy, referred to as the solar constant, is approximately 1370 W m-2 , which would be equal to 100% of the incoming solar (or shortwave) energy

The surface energy budget can be expressed as: dW/dt=Rn ± LE ± H ± G
dW is the change in energy (E) for a given area
dt is the change in time
Rn is net radiation (W m-2)
LE is latent heat (W m-2). To determine latent heat (LE) from ET all you have to do is multiply by the latent heat of vaporization (Lv). The latent heat of vaporization is largely a constant value (i.e., Lv =2.45 *106 J kg-1). Similarly, to convert from LE to ET all you would have to do to obtain ET is divide LE by the latent heat of vaporization. But what does the latent heat of vaporization tell us? The latent heat of vaporization is the amount of energy that is needed for a phase transformation of 1 kg of water to go from liquid to gas.
H is the sensible heat flux (W m-2). H is the energy that goes into the heating of the surface through conduction; while LE is the energy expended in the transformation of liquid water to vapor. Fluxes are positive when they are towards the surface and negative when they are away from the surface. When the surface is warmer than the air above, heat will be transferred upwards from the surface into the air. In contrast, if the air is warmer than the surface, heat is transferred from the air to the surface. Heat is also transferred from the surface downwards via conduction (this is referred to as the ground heat flux). Heat is transferred downwards when the surface is warmer than the subsurface; however, if the subsurface is warmer than the surface, then heat is transferred upwards.
G is the ground heat flux (W m-2). ~2 m beneath the surface, the soil temperature is ~constant.
Albedo (α): The ratio of the shortwave reflected radiation to the incoming shortwave radiation.
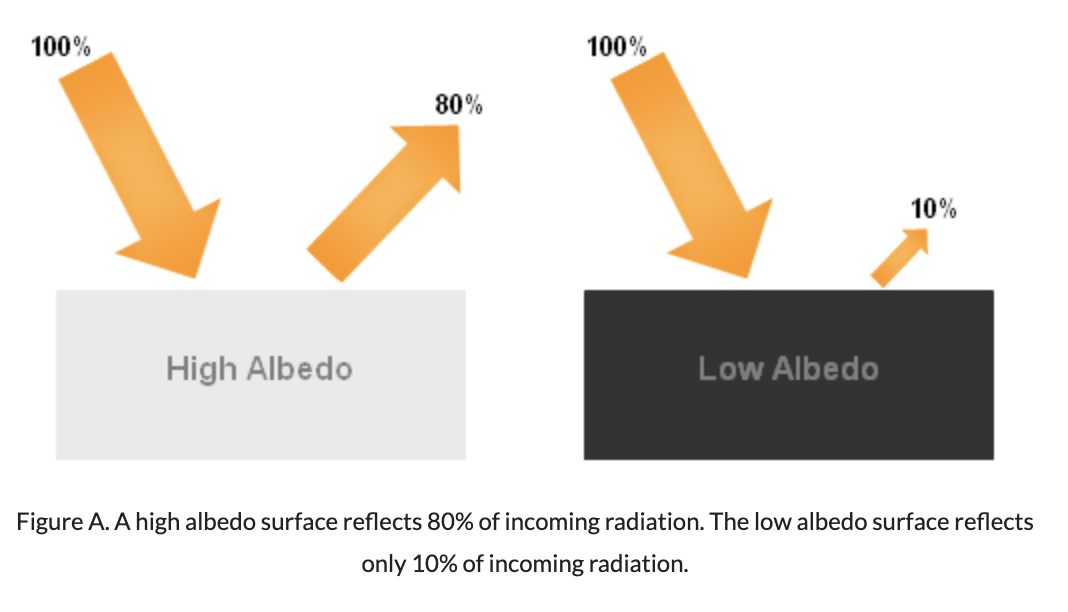
A high albedo means the surface reflects the majority of the radiation that hits it and absorbs the rest. A low albedo means a surface reflects a small amount of the incoming radiation and absorbs the rest.
The Earth has an Average Albedo of .3 (30%).
High Albedo: More Reflection, Less Absorption.
Low Albedo: Less Reflection, More Absorption.
The balance between incoming and outgoing radiation (Rn):
Rn=Rswdown(1-α)+Rlwdown – Rlwup
α is the albedo
Rlwup is a function of the temperature of the surface of the Earth
Rlwdown is largely a function of the cloud cover (so Rlwdown will be approximately zero on a clear night).
Net radiation is essentially the amount of longwave and shortwave energy that is available for an area.


Solar radiation strikes perpendicularly near the equator with the average incoming solar radiation approximately equal to 270 W m-2. In contrast, near the poles solar radiation strikes at an oblique angle, with the average incoming solar radiation equal to ~90 W m-2. This creates an energy imbalance between the poles and the equator.


Precipitation

Process of Precipitation
Cooling as the parcel of air rises until it reaches the dew point temperature.
Cools at the Dry Adiabatic Lapse Rate: 1C/100m.
Adiabatic: No heat exchanged with surrounding air.
As parcel of air rises, the pressure decreases, and the volume increases.
Air parcel rises via
Convergence
Convection: Warm air rises due to solar warming.
Air rises and cools giving off latent heat that helps other air around it to rise and cool.
Storms tend to be shorter and more intense.
Orography
Cloud Condensation Nuclei
Normally Clay, Sea Salt, Volcanic Material (ash), smoke (aerosols) of which water droplets condense onto.
Droplet Growth until their size exceeds the rate of uplift. Occurs by two methods: 1) Collision with other droplets and 2) ice crystal growth. Size required to drop: ~500-4000uM in diameter.
Supply of Water Vapour to replace moisture that falls out of the cloud.


Measuring Precipitation
2 types of Rain Guages
Non-Recording
Recording
Where to place Rain Guages
The windier, the more error.
As a rule of thumb, the distance between the protection and the gage should be at least twice the height of the protection above the collector but no less than the height of the protection
Freshly Fallen snow has equivalent of 5-20%


Soil Classifications
Soil Texture is determined by the proportions of sand, silt, and clay after particles larger than sand are removed.
Soil: A matrix of solid grains between which are pore spaces containing water and air (Grains, Water, Air).
Sand: .05-2mm
Silt: .002-.05mm
Clay: <.002mm


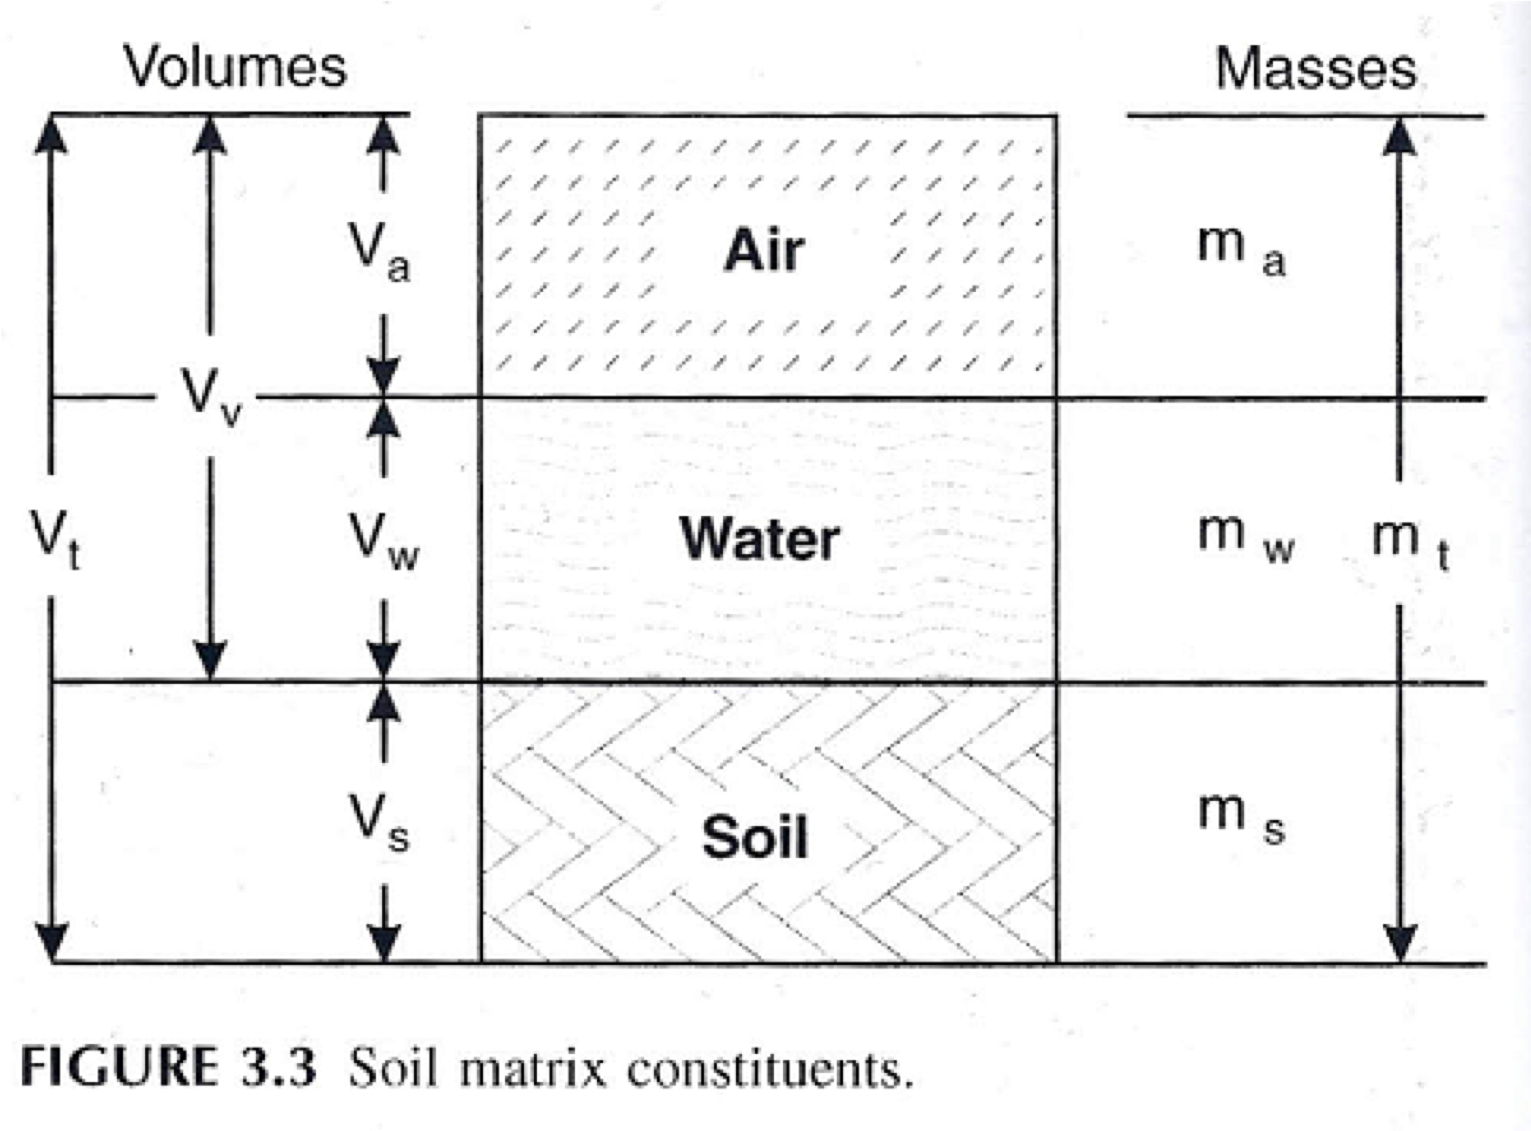
Vt= Vair + Vwater + Vsoil
Mt= Ma + Mw + Ms
Density= Mass/Volume
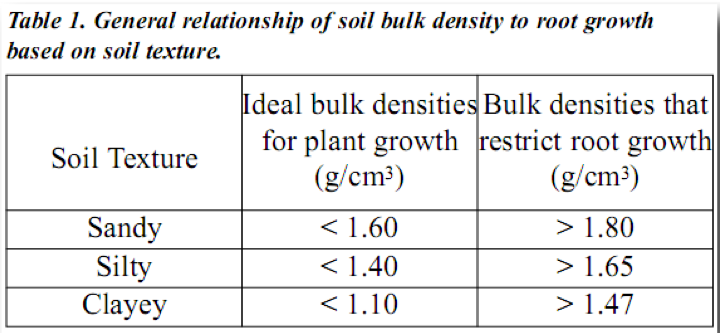
Bulk Density (ρb) : The mass of the solid relative o the volume of the soil:
ρb=Ms/Vt=Ms/(Va+Vw+Vs)
Increases with Depth due to compaction.
Measuring Bulk Density
Taking a sample of soil with a ‘corer’ of known volume.
Dry the sample at ~105C overnight
Weigh the sample
Divide this mass by the volume
Methods for measuring bulk density
Other Methods:
Excavation Method: In this method, a hole is dug and all of the removed soil is retained and weighed. The volume of the hole is determined by placing a plastic bag/balloon in the hole and filling it with water/air until it is flush with the surface.
Clod Method: In this method, a soil sample is taken and coated with a substance such as paraffin that prevents water from entering the clod. This clod is then weighed and the amount of water displaced by the clod is equal to its volume.
Radiation Method: In this method, gamma radiation is emitted at a known rate and the rate at which this radiation is transmitted through or reflected is related to the density of the surrounding soil.
Various Soil Terms
Soil Particle Density (Ps) = Ms/Vs
Generally assumed to be a constant value at 2650km/m3 (2.65g/cm3)- which is the density of quartz.
Porosity (φ) : Proportion of pore spaces in a soil.
φ=(Va+Vw)/Vt
Decreases with Depth due to compaction.
Human impact has totally fucked up compaction and porosity.
In general, finer grained soils tend to have higher porosities than coarse grained soils.
Soil Water Content (θ) & Degree of Saturation or Wetness (S)
Volumetric Soil Water Content (θ): θ=Vw/Vt
Proportion of Pores filled with Water (S): S=Vw/(Va+Vw)=θ/φ
Total amount of water in a soil layer (expressed as a depth)=
θ ∗Thickness of soil layer.
Measuring Soil Water Content
Neutron Moisture Meter: probe that emits high-energy neutrons that collide with the nuclei of atoms in the soil and also a detector that measures the percentage of neutrons that have had their energy changed. The energy emitted by the neutron moisture meter is only changed by collisions with hydrogen nuclei
Ads: Measurements can be taken at several depths and they are very accurate.
Disads: Working with Radioactive Material, expensive, requires extensive calibration, measurements are not continuous in time.
Time Domain Reflectometer: based on the principle that water, air and soil have different dielectric constants. For this probe, a pulse of electromagnetic radiation is emitted along dual probes which have been inserted into the soil. This pulse is reflected and returned at a velocity characteristic of a specific dielectric constant.
Ads: Accurate and continuous in time.
Disads: Probes measurements are affected when scratched.
Microwave Remote Sensing: Provides information on a continual basis about the soil-water content over a large area.
Ads: Active (RADAR) have high resolution (1km2) but measurements is made difficult by surface roughness and vegetation.
Passive (satellite) are less affected by surface conditions but have a lower resolution (100-1000km2).
Average monthly soil moisture over the time period 1979-2010: http://www.esa-soilmoisture-cci.org


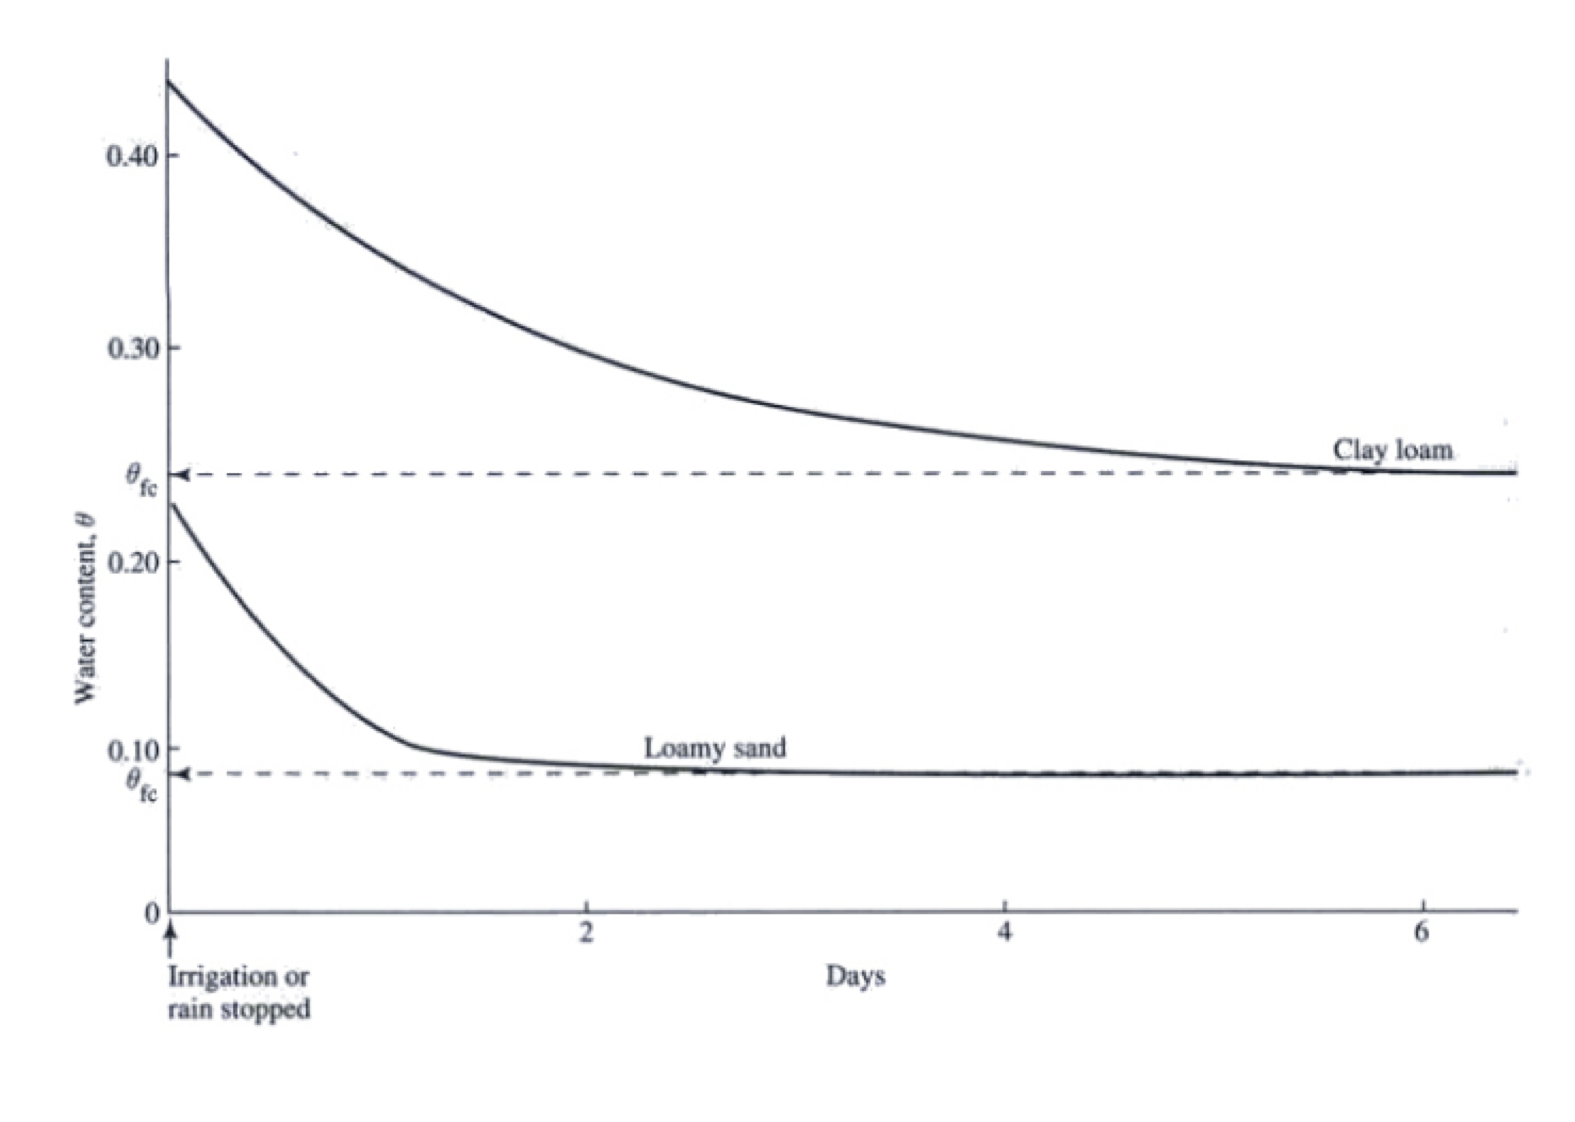
A soil’s field capacity is the water content once a soil is fully saturated and has been allowed to drain (θfc). This is an index of the water content that can be held against the force of gravity.

Surface Tension
In unsaturated soils, water is held to mineral grains by surface tension forces, also known as capillary forces.
Movement of water through a soil is caused by tension and gravitational forces.
When water moves into a pore, gravity and tension forces work together. Gravity pushes the water into the pore and tension pulls water into the pore. However, the opposite is true when a pore drains (i.e., gravitational and tension forces work against each other).

Cohesion: Attraction between molecules caused by a difference in charge.
Water: Oxygen Side carries a negative charge while the hydrogen side carries a positive charge
Adhesion: ability of a liquids particles to attract to different particles.
The radius of the tube would be synonymous with the radius of the pore space. Up to this point, we have learned that finer grained soils tend to have higher porosities than coarse grained soils.
You can interpret this image as meaning that water is retained more tightly in a clay soil than a sandy soil. So, the height (capillary pressure head) that the water rises in the pore is inversely proportional to the radius of the pore.
Tensionometer: Used to measure Soil Water Pressure

Highly non-linear relationship between pressure head (ψ) and water content (θ): |ψ(θ)|=|ψae|· (φ/θ)b
b can be thought of as the pore-size distribution index. This is largely controlled by soil type
ψae, which is the point where significant volumes of air begin to appear in the soil pores.
Understanding the relationship between soil water pressure and soil water content is important for understanding the water that is available for plant uptake. In order to overcome surface tension forces that hold water in between the mineral grains, plants have to exert a suction. This is why tension is oftentimes the more relevant term to understanding the amount of water available to a plant. In general, plants cannot exert a suction stronger than 15,000 cm to extract water.


Hydraulic Conductivity (Kh): The rate at which water moves through a porous medium.
Kh(θ)=Kh*·(θ/φ)c
Under saturated conditions, it is largely determined by the soil-grain size. However, under unsaturated conditions, the hydraulic conductivity is determined by grain size and the degree of saturation.
The parameter c can be thought of as the pore-disconectedness index (ratio of the length of the path followed by water in the soil to a straight line path): c= 2b +3
The degree of saturation significantly influences the hydraulic conductivity (Kh). This is the case because water flow avoids air pockets and thus, Kh is reduced as air pockets fill void spaces.

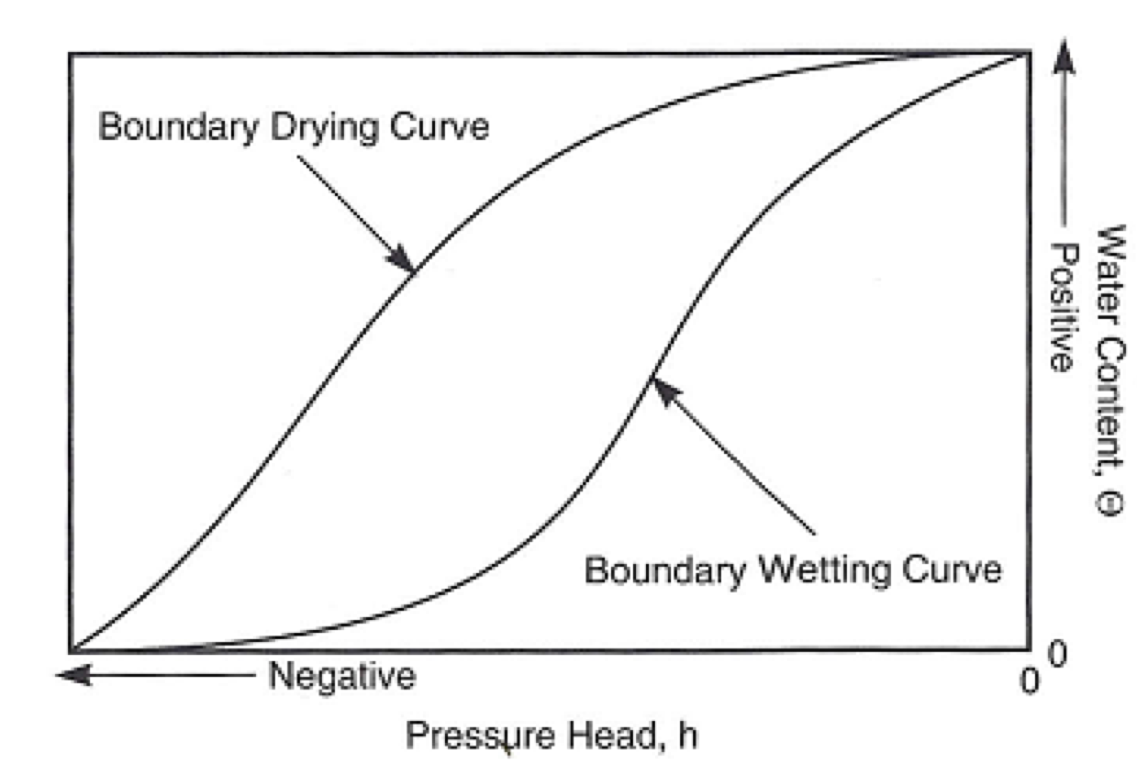
Moisture Characteristic Curve: relationship between the pressure head and water content.
Infiltration
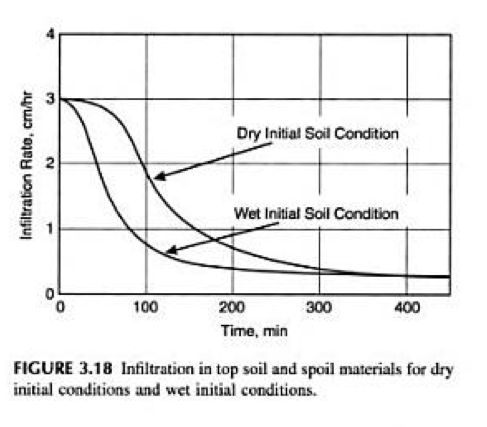
Infiltration rates decrease as soil water content increases
How to model water flow in an unsaturated soil:
Darcy’s Law describes the flow of water in an unsaturated, porous material (Q): Q= -Kh*A(dh/L)
dh: hydraulic gradient
Kh: hydraulic conductivity
A: area
L: Flow Path Length
flow rate is proportional to the hydraulic gradient
Horton: f=fc+(f0-fc)*e-βt
f is the infiltration rate at time t
fc is the final infiltration capacity
f0 is the infiltration rate at time zero
β is a best fit parameter
Green & Ampt Model
Ring Infiltrometer
Infiltration rate can be determined in several ways:
Ponding the surface from above and measuring the rate at which the level of ponded water decreases.
Measuring the rate at which the water has to be added to maintain a constant level of ponding;
Using a water balance approach where the infiltration rate is calculated as: f(t)=(W-Q-∆H∙A)/∆t
W is the volume of water added
Q is the volume of ponded water
ΔH is the change in ponded-water level
A is the area covered by the infiltrometer

Evapotranspiration (ET): the process by which water in the liquid phase becomes a gas.
Approximately 3.4% of all water available annually was withdrawn for irrigation in the U.S. with 60% of this amount being evapotranspired

~62% of precipitation that falls over land is evapotranspired.
97% of ET takes place over land while the remaining 3% evaporates from open water

Evaporation: Thermal Agitation within a water molecule provides energy for it to “escape” the internal bonds of the liquid and be absorbed into the air.
The energy that a molecule of water needs to penetrate the water surface is the latent heat of vaporization.
Diffusion: Molecules move from an area of high concentration to an area of low concentration (aka Fick’s First Law).
Concentration of water molecules in the air space increases, the rate of diffusion decreases.
Evaporation ceases is when the air has reached its saturation vapor pressure (es*) because there is no longer a concentration gradient driving diffusion.
Two important factors in the evaporation process are:
A source of energy to supply the latent heat of vaporization (the energy that a molecule of water needs to undergo a phase change from liquid to vapor).
Concentration gradient in water vapor, which is typically provided by air movement (wind) that removes the water vapor directly above the evaporating surface.
Evaporation (E): E=Ke·va·(es-ea)
es: vapor pressure of the evaporating surface.
ea: vapor pressure of the evaporating air.
va is the wind speed
Ke is a coefficient that describes the efficiency of eddies in the lower atmosphere of being able to transport water vapor.
Vapor Pressure:
Water vapor is transferred between the surface and the air whenever there is a difference in the vapor pressure between the surface and the overlying air.
Saturation vapor pressure (es*) is a function of temperature and it is the maximum amount of water that can be held by the air.
es^∗=0.611∙exp((17.3∙Ts)/(Ts+237.3)) where es^* is in kPa & Ts) is in C.
Vapor pressure deficit: the difference between the saturation vapor pressure and the actual vapor pressure of the air.
Vapor pressure in the air (ea) depends on the relative humidity (Wa) & the air temp (Ta).
ea=Wa·ea*, where ea* is the saturation vapor pressure at the current air temperature.

Potential Evaporation (PET): the amount of ET that would occur if water were unlimited.
Actual Evapotranspiration (AET): the actual amount of ET that occurs because water is limited.
AET and PET are most similar in areas that have a high relative humidity, and differ the most when there is low relative humidity and high temperature.
Bare Soil Evaporation
Evaporation from bare soil is typically divided into two stages:
An atmosphere controlled stage where the water content of the soil surface is at or near saturation and the rate of evaporation is controlled by surface energy conditions such as wind and heat input. During this stage, evaporation from bare soil is similar to evaporation from open water only when the soil is saturated. This occurs at a relatively constant rate.
The second stage is a soil controlled stage. This stage starts once the soil surface has begun to dry. The evaporation rate during this stage is primarily controlled by soil properties such as soil texture and hydraulic conductivity. As the soil drys, there is a corresponding change in albedo that occurs with a decrease in soil water content.
Interception: Retainment of water on the surface of leaves.
The amount of water intercepted depends strongly on: vegetation type, time of year and stage of plant development as well as the intensity, duration, frequency and form of precipitation
The proportion of annual precipitation intercepted can range between 10 to 40%.
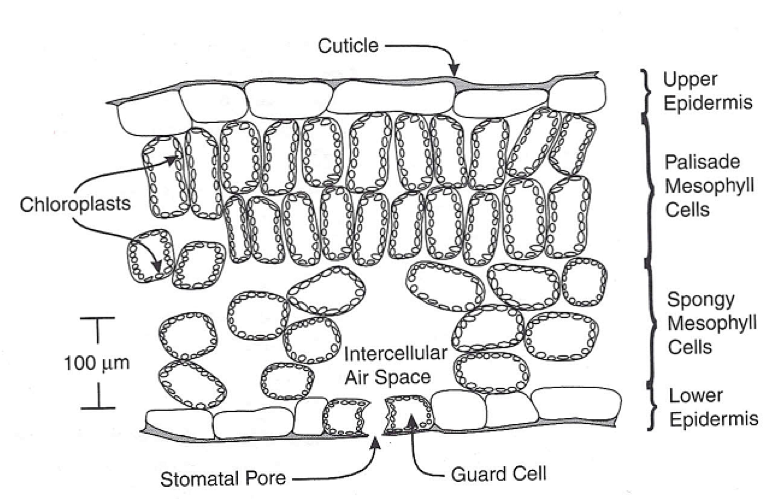
Transpiration: the process by which soil water is absorbed through the roots, transported through the vascular system of the plant to the leaves and through stomatal cavities into the atmosphere.
The air in the intercellular spaces is typically close to saturated. This gradient causes vapor to diffuse out of the stomates and into the atmosphere. The larger the vapor pressure gradient between the air in the stomatal cavities and the air at the surface of the leaf, the higher the rate of diffusion and the faster evaporation will occur.
Once water has been removed from the intercellular air space, this effectively pulls water into the plant through the roots, up the xylem and into the leaves.
In order to assimilate CO2, the plant must open its stomata; however, at the same time, the plant loses water to the atmosphere. While there are many mechanisms by which plants can reduce transpiration rates such as: reducing the leaf area, or changing leaf orientation to reduce the amount of solar energy reaching the plant.
There are several factors that affect transpiration rates:
The type of plant: the depth of the rooting system can give the plant access to more stored water.
Wind: by breaking up the saturated layer of air closest to the leaf, wind can increase transpiration rates. As we have learned in the last couple of slides, a concentration gradient in water vapor is important to driving the process of ET.
Plant available water (PAW): plants transpire at maximum rates when the soil is at field capacity and stop transpiring at the wilting point. However, for soil water content values greater than field capacity, roots are deprived of oxygen and transpiration can be curtailed.

In general, rates of transpiration remain at levels close to field capacity down to about 50% PAW at which point transpiration begins to slow. While several different models are shown in the image above, the Pierce curve is the most commonly accepted.

Stomata (aka Stoma): the pore that connects the intercellular spaces with the atmosphere.
Each stoma can open or close by changing the size of the guard cells at the edge of the pore. This is one way that the plant can control how much water they are transpiring. The major factors affecting the opening and closing of guard cells are:
Light: most plants open stomata during the day and close them at night.
Humidity-stomatal openings tend to decrease as humidity decreases below its saturation value.
Water content of leaf cells-if these values become too low, stomata tend to close.
Open Stomata
H20: Increase in Transpiration
CO2: Able to process CO2 from the atmosphere.
Result: Loses excess water to transpiration but able to conduct photosynthesis.
Closed Stomata
H2O: Preserves Water.
CO2: Not processing CO2 from the atmosphere.
Result: Preserves water but not conducting photosynthesis.
The dehydrated tree roots send chemical signals to the stomata in the leaves via Abscisic Acid (ABA) acting as a hormone inducing the stomata to close.

Measuring ET
Evaporation Pan: Used to measure PET.
The standard in the U.S. is a class A pan, which is made out of galvanized steel, is 10 inches deep and 48 inches in diameter.
Lysimeter: device that allow the changes in water for a given area to be measured. There are two basic types:
Weighing: measure ET by weighing the entire unit with a mechanical spring while accounting for the weight of added water inputs and losses.
Non-weighing: measure changes in ET from measurements of rainfall and water drainage out of the bottom of the lysimeter.
Considered the best measurement of ET.
Eddy Covariance: If you know vertical wind speed, and water concentration at Time 1, and at Time 2, the vertical flux of water at this point in time can be calculated
The latent heat flux can be estimated as a covariance of the vertical wind velocity and the concentration of the entity of interest (i.e., water in this case). If we are interested in converting from the latent heat flux to evapotranspiration, we just need to divide the latent heat flux by the latent heat of vaporization, which is usually taken as a constant value.
Estimating ET
Water Balance Estimation
ET=P-Q (when the system is in steady state, i.e groundwater and changes in soil water storage are negligible).
Energy Balance Estimation
ΔQ/Δt=Rn ± LvE ± H ± G
Rn is net radiation
E is the rate of evaporation (kg m-2 s-1)
Lv is the latent heat of vaporization (2.45 *106 J kg-1)
H is the sensible heat flux (W m-2)
G is the ground heat flux (W m-2)
Rn can be expressed ass: Rn=Rswdown*(1-α)+Rlwdown – Rlwup
α is the albedo and it is the ratio of the shortwave reflected radiation to the incident radiation.
Given the above, we can estimate ET using the energy balance approach,
LE=Rn-G-H– ΔQ/Δt
Latent heat flux is equal to the latent heat of vaporization times the evaporation rate.
Thornthwaite Estimation
PET=16*[(10∗T)/I]a
T is the mean monthly temp in C
a is a location dependent coefficient
I is the heat index, I=∑ (sub: j=1, up: 12)[Tj/5]1.514
a= 6.75*10-7*I3 - 7.71*10-5*I2 + 1.792*10-2*I +0.49239
Not applicable to semiarid to arid areas and in general, is only applicable to areas that have a climate similar to the Eastern US.
Penmans Method:

Rn is net radiation
G is the ground heat flux
γ is the psychrometric constant
Δ is the slope of the saturation vapor pressure-temperature curve
u2 is the wind speed measured 2m above the ground
es - ed is the vapor pressure deficit
λ is the latent heat of vaporization.


Reducing ET
Crop Choice
Drip Irrigation
Covering Soil with plastic sheeting
Applying water at optimal times.
Applying only the required amount of water.
Runoff
A significant portion of rainfall in forested watersheds is absorbed into soils (infiltration), is stored as groundwater, and is slowly discharged to streams through seeps and springs. Flooding is less significant in these more natural conditions because some of the runoff during a storm is absorbed into the ground, thus lessening the amount of runoff into a stream during the storm.
As watersheds are urbanized, much of the vegetation is replaced by impervious surfaces, thus reducing the area where infiltration to groundwater can occur. Thus, more stormwater runoff occurs—runoff that must be collected by extensive drainage systems that combine curbs, storm sewers (as shown in this picture), and ditches to carry stormwater runoff directly to streams. More simply, in a developed watershed, much more water arrives into a stream much more quickly, resulting in an increased likelihood of more frequent and more severe flooding.
Meteorological factors affecting runoff:
Type of precipitation (rain, snow, sleet, etc.)
Rainfall intensity
Rainfall amount
Rainfall duration
Distribution of rainfall over the watersheds
Direction of storm movement
Antecedent precipitation and resulting soil moisture
Other meteorological and climatic conditions that affect evapotranspiration, such as temperature, wind, relative humidity, and season.
Physical characteristics affecting runoff:
Land use
Vegetation
Soil type
Drainage area
Basin shape
Elevation
Slope
Topography
Direction of orientation
Drainage network patterns
Ponds, lakes, reservoirs, sinks, etc. in the basin, which prevent or alter runoff from continuing downstream
Hyetograph: a graph of the amount of water that is input (i.e., as precipitation) as a function of time. Water Input vs. Time.
Hydrograph: a graph of stream discharge at a given stream cross-section as a function of time. Water Output vs. Time.

Discharge = Area of stream cross-section*Velocity of water through the cross-section
Frequently used units for discharge are volume per unit time (frequently it is cubic feet per second, abbreviated as cfs).
Gage height is synonymous with stream depth

Rising limb: the portion of the hydrograph characterized by increasing streamflow up to the peak flow rate.
Falling limb: decreasing discharge following the peak flow rate.
Hydrograph separation line: separates event flow from baseflow.
Event flow (aka storm flow): portion of flow that is attributable to both precipitation and water (such as pre-event soil water) that has moved through the system as a result of the increase in water flow through the soil profile.
Baseflow: groundwater (could also include soil water draining to a stream).
Time of rise: duration of time starting from when water is input to the system and ending when the hydrograph peaks.
Time of concentration: time it takes water to travel from the most distant part of the contributing area in the watershed to the outlet.
Stream response to a precipitation event is determined by several factors":
The spatially and temporally varying precipitation input rates across the watershed.
The time required for each drop of water to travel from where it falls to get to the stream network.
The time required for the water to travel in-channel from the point where it enters the stream to where it is measured. This amount of time is often determined by the length of the channel. In small watersheds that are less than 50 square kilometers, it is mostly determined by the hill slope travel time, while in larger watersheds, the travel time throughout the stream network becomes increasingly important.
Bank storage: the lateral exchange of water between the channel and banks.

Watershed characteristics that affect the response time are:
watershed size
soils and geology
slope
land use
Flow duration curve (FDC): a cumulative frequency curve that shows the fraction of time that streamflow exceeds a given value over a period of interest (generally average daily discharge is used):
FDC is useful because it provides you with information pertaining to characteristics of the watershed.

1. Obtain daily streamflow data for period of interest: http://waterdata.usgs.gov/dc/nwis/rt
2. Sort low to high and then rank data
3. Calculate the Exceedence Probability (EP) from the formula above. M is equal to the rank of the value of interest and n is equal to the number of values within the set.

-The slope of the upper end of the curve is determined principally by climate and precipitation characteristics. The slope of the upper end is relatively flat where snowmelt is the major cause of floods and for large streams where floods are caused by long duration storms. Flashy, urban watersheds and watersheds affected by short duration storms tend to have steep upper ends
-The slope of the lower portion of the curve is primarily affected by geology and topography. A flat lower end slope usually indicates that a relatively large percentage of the flow comes from storage in groundwater aquifers or frequent precipitation inputs. A steep lower end indicates an absence of significant storage.
Mechanisms Producing Runoff
Water flow occurs in response to spatial gradients of potential energy, which is comprised of the gravitational potential energy gradient and the pressure potential energy gradient
Channel precipitation: rain that falls directly on the stream and is incorporated in channel flow. This volume can be calculated as: Wcp=W·Acn . W is the total amount of rain and Acn is the surface area of the stream above the channel measurement point. For smaller watersheds, this has been found to contribute up to 40% of total event flow.
Overland flow: consists of two mechanisms:
Hortonian overland flow: where the soil is saturated from above. This occurs when the water input rate is greater than the saturated hydraulic conductivity for a duration of time that exceeds the time of ponding. Important in semi-arid to arid regions where rainfall intensities tend to be intense and/or natural surface conductivities low, and areas where soil frost or human activity has decreased the infiltration rate.
Saturation overland flow: where the soil is saturated from below. Once the soil saturates from below, additional water cannot infiltrate into the soil and this water travels as saturation overland flow. The major mechanism producing event runoff in humid regions and forested areas.
Subsurface Event Flow
Darcy’s Law: Q= -KA(dh/L).
Describes flow of water in a homogeneous material.
KEY: rate of flow is proportional to the hydraulic gradient
Basic relationship to characterize the flow of water in an unsaturated, porous material.
Interflow: Downslope flow occurring between the ground surface and water table.
Macropore Flow: Rapid subsurface response to water input can occur through large pores produced by roots and soil fauna. Typically these pores are on the order of 3 to 100 mm in diameter.


As it flows over the land surface, stormwater picks up potential pollutants that may include sediment, nutrients (from lawn fertilizers), bacteria (from animal and human waste), pesticides (from lawn and garden chemicals), metals (from rooftops and roadways), and petroleum by-products (from leaking vehicles). Pollution originating over a large land area without a single point of origin and generally carried by stormwater is considered non-point pollution. In contrast, point sources of pollution originate from a single point, such as a municipal or industrial discharge pipe. Polluted stormwater runoff can be harmful to plants, animals, and people.
Runoff can carry a lot of sediment
When storms hit and streamflows increase, the sediment moved into the river by runoff can end up being seen from hundreds of miles up by satellites. The right-side pictures shows the aftermath of Hurricane Irene in Florida in October 1999. Sediment-filled rivers are dumping tremendous amounts of suspended sediment into the Atlantic Ocean. The sediment being dumped into the oceans has an effect on the ecology of the oceans, both in a good and bad way. And, this is one of the ways that the oceans have become what they are: salty.
Modeling Rainfall Runoff
Important to predict streamflow to better understand:
Response to extreme events
Major land use change
Altered climactic regimes
NRCS/SCS Method:
NCRS is generally used for small watersheds and/or culverts
Estimates Q (effective rainfall or accumulated runoff) using, Q=((P-Ia )^2)/((P-Ia+S)) where P is precipitation, and S is estimated as S=(1000/CN)-10
CN is the curve number, which can be adjusted to reflect the antecedent wetness of the watershed and Ia is usually 0.2S
SCS is generally used for sub-urban and rural areas.

The basic calculation in this method, which you will see on the next slide, is the estimation of effective rainfall. This estimate takes into account the ability of a given soil to infiltrate water, the land use, and the soil water conditions at the start of the event.


When a watershed consists of more than one soil/land, a weighted average curve number is typically used.

The rational method: generally used for urban areas.
The equation for the rational method is expressed as qsub(pk) = uR*C*i*A
uR is a conversion factor (1.008).
C is the runoff coefficient.
A is drainage area.
i is the average rainfall intensity, whose duration is equal to the time of concentration of the watershed.
Time of concentration: the time it takes for water to flow from the most remote point on a watershed to the outlet of the watershed. is frequently determined using the Kirpich equation,
tc=0.00778L^0.77*S^-0.385
S is the mean slope and is expressed as a fraction and the longest flow path is the hydraulic length (L).
The Kirpich equation has been shown to estimate time of concentrations that are too rapid.


Unit hydrograph: generally used for large watersheds. This is considered the best method.
Generally gives estimates of flood peaks that are within 25% of their true value and the assumption of linearity is most valid for large watersheds that have an area greater than 100 km2.
Method Assumptions
There is a uniform distribution of excess rainfall over the watershed.
There is a uniform rainfall excess rate.
The runoff rate is proportional to the runoff volume for a rainfall excess of a given duration..
Open Channel Flow: flow of water in streams, ditches, channels and large rivers where the surface of the flow is open to the atmosphere.
Flow in a stream is a function of many watershed specific factors such as:
Vegetation cover
Precipitation patterns
Overland flow characteristics
Contribution of groundwater to streamflow
Characteristics of the Stream Channel.
Cross-sectional area
Slope of the channel
Channel roughness
Meanders
Sediment transport
Channel stability
Uniform v. Non- Uniform Flow

Uniform Flow: fluid is assumed to have the same velocity and direction at every point
Non-Uniform Flow: At any given instant, the velocity is not the same at every point.
Steady v. Non-Stead Flow

Steady flow: the conditions of velocity, pressure, and cross-section may differ from point to point but do not change with time.
Non-Steady Flow: If at any point in the fluid, the conditions change with time, the flow is described as unsteady.
Flow Categorization
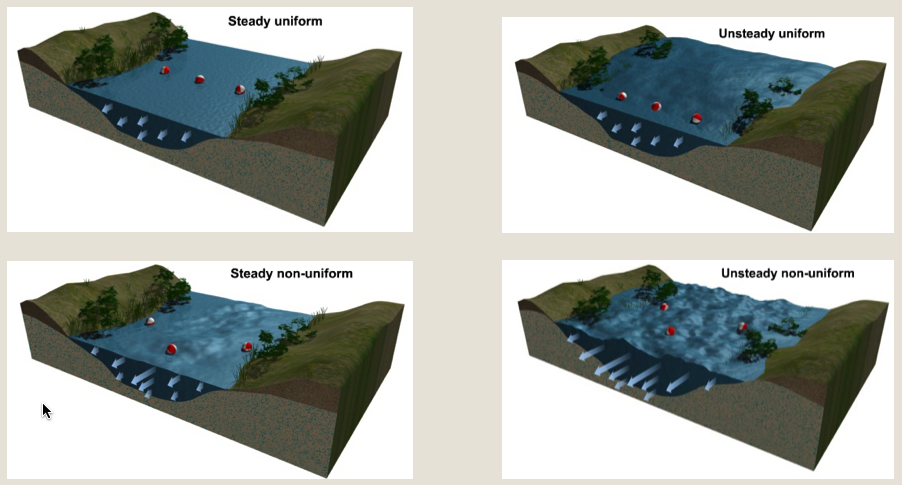
1. Steady uniform flow: Conditions do not change with position in the stream or with time.
2. Steady non-uniform flow: Conditions change from point to point in the stream but do not change with time.
3. Unsteady uniform flow: At a given instant in time the conditions at every point are the same, but change with time.
4. Unsteady non-uniform flow: Every condition of the flow may change from point to point and with time at every point.
Determining Flow Velocity
Mannings Equation for Uniform Flow:
Most Commonly used method.
Best suited for uniform, steady open channel flow.

v is the flow velocity (ft/s)
n is Manning’s n, which is a coefficient of roughness. If the flow is deep relative to the size of the bed material, n can be estimated using the following equation: n=0.04(d50)^(1/6) where d50 is the mean bed material size (meters).
R is the hydraulic radius (a/P) where P is the wetted perimeter (ft) and a is the cross sectional area (ft2)
S is the channel bed slope (fraction)
1.49 is a unit conversion factor (Use 1 for metric).

Conceptualizing Mannings Equation

Mannings “n”
Using the maximum value of Manning’s n will provide you with the lowest estimate of flow while using the minimum value of n will provide you with the highest estimate of flow.
Darcy- Weisbach Equation
Measures Flow Velocity
Takes into account the particle size of the channel bed, which can be determined from a pebble count.
A pebble count is done by setting up a cross section across a stream and using a gravelometer to determine the diameter of particles that are greater than 2 mm. To conduct a ‘pebble count’, you randomly pick up a pebble at each consecutive point going across the cross section and write down the diameter of this pebble. You can then use this information to plot a cumulative frequency distribution curve.
v^2=(8gRS)/f
R: Hydraulic Radius
S: Channel Bed Slope
g: acceleration due to gravity (9.81m/s2)
f: friction factor: f^(-0.5)=2.03 log〖(xR/(3.5d84 ))〗
x=11[R/y]^(-0.314) .
y is the max flow depth for width to depth ratios greater than 2.
d84: refers to the particle diameter, which you can take off the cumulative frequency chart that 84% of the particle sizes are finer then.

Cumulative Frequency Distribution Curve

General Flow Equation (aka Continuity Equation for Steady Flow of an Incompressible Fluid: Determines Discharge of a flow.
Once you have obtained velocity (possibly from either Manning’s Equation or the Darcy-Weisbach Equation), you can use the general flow equation to determine discharge.
General Flow Equation: q = va
q: flow rate in cfs or m3/s
v: average velocity of flow at cross section (ft/s) or (m/s).
a: area of the cross section (ft2 or m2).
Flow Energy
There are three flow regimes that can occur in an open channel and are classified based on the relationship between actual water depth, normal water depth, and the critical depth. Normal depth: the depth of flow that would occur if the flow was uniform and steady.
Critical depth: the depth of flow where energy is at a minimum for a particular discharge.
Subcritical: For deeper depths, the flow will be stable and the velocities relatively slower.
Uniform Flow is one type of Subcritical Flow.
Characterized by Froude numbers that are less than 1.
Occurs when the actual water depth is greater than critical depth.
Dominated by gravitational forces and behaves in a slow or stable way
Critical: Froude number equal to 1.
Flow that possesses the minimum possible energy
Supercritical: For the shallower depth, the flow will be unstable and the velocities relatively higher.
Characterized by Froude numbers greater than 1.
Dominated by inertial forces and behaves as rapid or unstable flow
Supercritical flow transitions to subcritical through a hydraulic jump.
Actual depth is less than critical depth.
Hydraulic Jump: When rapidly flowing liquid is abruptly slowed, it increases in height, converting some of the flow's initial kinetic energy into an increase in potential energy, with some energy irreversibly lost through turbulence to heat. In an open channel flow, this manifests as the fast flow rapidly slowing and piling up on top of itself. A high energy loss with erosive potential.
Calculating the Specific Energy of a flow:
E = (v^2/2g)+d
E: Specific Energy (ft) or (m).
v: Mean Flow velocity (ft/s) or (m/s).
g: gravitational constant (9.81m/s2)
d: depth (m) or (ft).
The specific energy of the flow is the energy head relative to the channel bottom.
E=((q/w)^2)/(2gd)^2) +d
w: width of the stream cross section.


Groundwater
Constitutes 30% of the world’s total fresh water (percentage is higher for arid regions).
In the U.S., groundwater accounts for ~25% of the water used for domestic, irrigation and industrial uses.
Infiltrated water can carry contaminants from agriculture, industries and waste-disposal sites to the groundwater reservoir.

Aquifer: a geologic unit that can store and transmit water at a rate fast enough to be hydrologically useful.
There are two major types of flow that are distinguished by the nature of their upper boundary:
Unconfined: The upper boundary of the groundwater flow is the water table.
Recharge typically occurs from water percolating vertically to the water table after it has traveled through the overlying substrate.
A decrease (increase) in hydraulic head is reflected by the lowering (raising) of the water table.
In an unconfined aquifer, specific yield is the water released from pumping an aquifer down by a unit of head.
2) Confined: The aquifer is saturated throughout and bounded above and below by confining layers.
Recharge typically occurs from the upstream end where flow is not confined.
a unit decrease (increase) in head is reflected by a lowering (raising) of the potentiometric surface (aka the water table). The decrease (increase) in storage accompanying the head decrease (increase) is due to: 1) compression (expansion) of the aquifer as the weight of the overlying material is transferred from (to) the liquid to (from) the solid grains, resulting in a slight decrease (increase) in porosity; and, 2) a slight expansion (compression) of the water due to the lowered (increased) pressure.
Triangle with line beneath it symbolizes Groundwater surface.
Hydraulic Conductivity
‘Hydraulic Conductivity (also known as Permeability) is a measure of how fast water flows through certain soils or rock layers. Hydraulic Conductivity (Kh), is a function of soil suction and soil water content.
Fine grained soils tend to have lower hydraulic conductivity than coarse grained soils.


Groundwater Storage Properties
Hydraulic Head: measure of the PE available for gw flow.
Hydraulic Head = Pressure Head + Elevation Head + Velocity Head (VH is often neglected when considering gw flow).
Measured by lowering an electronic tape (or a steel tape with chalk on it) into a well. These measurements can be used to create a potentiometric map.
Equipotential lines represent lines of equal energy, so water will flow in the direction from higher equipotential lines to lower equipotential lines.
Hydraulic head (Depth) = Elevation of Measuring Point – Value obtained from electronic tape.

Specific yield (Sy): the volume of gw that will drain under gravity relative to the total volume of the aquifer.
The difference between Sy and φ is termed the specific retention (Sr), which is the amount of water that will not drain under the influence of gravity.
Aquifer Types
Isotropic: hydraulic conductivity is the same for all directions
Anisotropic: hydraulic conductivity differs for different flow directions
Homogenous: If the conductivity in all directions is the same at all points
Heterongeous: If the conductivity in any direction is different.

Darcy’s Law: Q=KA (dh/L)
Darcy’s Law is a basic relationship that can be used to describe the flow of water in an unsaturated, porous material. The key here is that the rate of flow is proportional to the hydraulic gradient (dh/L), so the hydraulic gradient represents the gradient of PE that induces flow.
Water moves from regions of high energy to regions of low energy (High gravitational potential gradient is one driving force of flow).
Groundwater Flow Patterns
Elevation gradient
Location of recharge and discharge areas
Heterogeneity of the geologic materials
The thickness of materials
The configuration of the water table.
Gaining Stream: A stream found in a discharge area to groundwater flow. the stream’s discharge increases in the downstream direction
Losing Stream: discharge decreases in the downstream and is a zone of recharge to the groundwater table
Perennial Stream: Stream that flow all year.
Intermittent Stream: Stream that flow only during wet seasons
Ephemeral stream: flow only in response to a water-input event and are generally losing

Geology, depth to impermeable base and lateral dimension
Lithology: the mineral composition, grain size distribution and grain shape characteristics of rocks and unconsolidated geologic materials.
Controls the hydraulic conductivity.
Stratigraphy: the geometrical and age relations among the various formations (typically layered, with the exception of intrusive igneous rocks).
Structure: the general disposition, arrangement or positions of formation (regionally extensive mapable geologic unit with reasonably constant lithology).
Especially as modified by processes such as folding, faulting and intrusion.
An aquifer may comprise one or more formations.

Local flow system: water moves locally from a recharge area to the next adjacent discharge area. The more pronounced the relief, the deeper the local systems tend to extend.
Regional Flow system: groundwater flows from the recharge area farthest from the main valley (i.e., the divide) to the discharge area in the main valley.
Water Balance in a Drainage Basin extending to a depth where groundwater flow is negligible: P + Gin = Q + ET +Gout
Under these same conditions, the long term average water balance for the ground-water reservoir in the basin is: Ri + Rsw +Gin = CR + Qgw +Gout
Ri is recharge from infiltration
Rsw is recharge from surface water bodies
CR is capillary rise
Qgw is the groundwater contribution to streamflow
The net recharge rate per unit area (R) is. R=Ri + Rsw – CR
Assume that capillary rise is negligible, except in areas where there is a shallow water table and high evaporation rate.
Capillary Fringe:

Residence Time (Tr):
For an unconfined aquifer of saturated thickness (H), Tr can be expressed as: Tr = (SyH)/R
R is the recharge rate per unit area and is equal to R=Ri + Rsw – CR
Measuring Recharge to Infiltrated Water (Ri):
Chemical Tracers (Cl- or CFCs).
Must be present in measurable amounts in precipitation or highly soluble.
Must not be taken up or released by the vadose zone.
Must not be taken up or released by vegetation.
Measuring Recharge to Surface Water (Rsw):
Flow Gradient can be measured by comparing the water level in the stream with the head measured in a piezometer from a subjacent bed; or the levels in two piezometers inserted to different distances below the bed.
The groundwater flux towards the stream can be directly calculated using Darcy’s Law.
Calculating flow of gw (Qgw):
If the hydraulic conductivity and average water table elevations are known, flow nets can be used to determine the total flow into the stream reach.
The discharge per unit length of stream into a stream for each streamtube can be calculated as: Δqgw=Kh·Δh
Δh is the head difference between the stream and the next up-gradient equipotential line.
The total discharge per unit stream length for a reach, qgw is: qgw=n·Δqgw
n: number of streamtubes discharging to the stream.
The total flow into the stream for the reach, Qgw is: Qgw = L·qgw
ΔqGW and qGW have units of D2 t-1 (where D is any length unit (i.e., meters, feet) and t is time), n is dimensionless, L has units of D and QGw has units of D3 t-1 (i.e., flow units).


Drawdown: Pumping Groundwater from a balanced system.
Proportional to the pumping rate and decreases with distance at any time and increases with time at any distance.
The rates of change are controlled by aquifer properties such that for,
Lower Kh: larger drawdown spread over a smaller area.
Higher Kh: smaller drawdown spread over a larger area.
Lower Sy: larger drawdown spread over a greater area.
Higher Sy: smaller drawdown spread over a smaller area.

Streamwater Depletion: net effect of both the groundwater that is intercepted by the well, which would have otherwise gone to the stream and extraction from the stream due to locally induced head gradients.
Safe Yield: the rate at which gw can be withdrawn without producing undesirable effects including:
Reductions in streamflow that reduce surface water available for instream and withdrawal uses.
Reductions in the levels of lakes/wetlands.
Land subsidence.
Increased costs of pumping.
Water-Resource Management: the process by which governments, businesses, and/or individuals reach and implement decisions intended to affect the future availability and/or quality of water

Water supply: the maximum sustainable rate at which water can be withdrawn from existing sources without causing undesirable ecological, human health, economic, legal or other consequences.
Safe yield: the rate at which gw can be withdrawn without producing undesirable effects, some of which include: reductions in streamflow, reductions in levels of lakes/wetlands, land subsidence and increased costs of pumping
a more realistic expression of available water is the flow rate exceeded ‘most of the time’, which is the flow rate exceeded 95% of the time (i.e., q.95). You can use this as the safe yield
The definition of water supply is identical to the definition of safe yield, which is often used to specify a rate of water utilization that can be maintained more or less indefinitely and relied upon as a measure of the available water resources of a region or a specific water source.
Water Supply Shortages
Demand: rate at which water would be used at a given place for a given price.
Use: the rate at which water is applied to one or more purposes.
Shortage: when use is less than demand.
Resource shortage: demand exceeds the safe yield. Can be remediated by increasing supply or reducing demand through price increases.
Drought shortage: the current availability of water is less than the safe yield due to drought.
Infrastructure shortage: sustainable supply is greater than or equal to demand, but the infrastructure capacity is less than the demand.
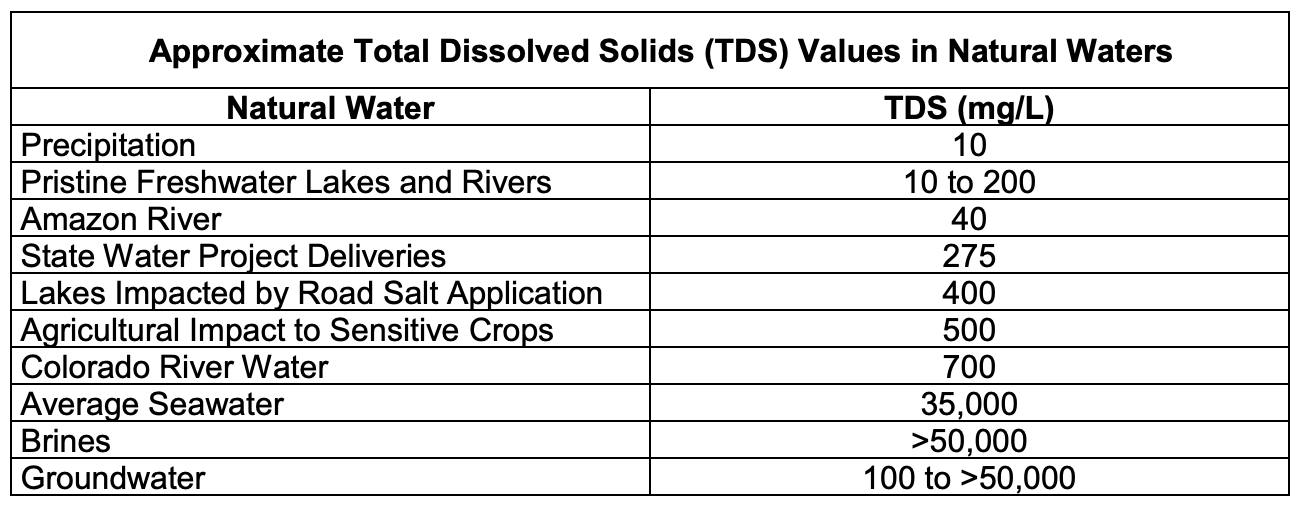
Water Quality
refers to the concentration of dissolved solids and gases, suspended solids, hydrogen ions, pathogenic organisms and/or heat in a given quantity of water
The concentration of dissolved and suspended solids can be expressed as a mass per unit volume
In the United States, water quality management efforts emphasize the Total Maximum Daily Load (TMDL) of constituents such as nutrients and dissolved oxygen
GW Contamination
The most common mechanism by which pollutants enter groundwater is the downward percolation of pollutants from surface or near-surface sources, leakage from sources above the water table and via salt water intrusion.
Point sources are those of less than a few acres (i.e., landfills, spills and injection wells).
Nonpoint sources range in size from several acres to hundreds of square miles (i.e., pesticides, fertilizers, organic wastes from nutrients and septic tanks).


Surface Water Contamination
Point sources tend to be discrete pipes or canals
Nonpoint sources would include groundwater discharges to streams and diffuse flows from the land surface.
One type of surface water pollution is acidification, which arises because sulfur and nitrogen compounds produced by burning of fossil fuels in power plants, factories and automobiles are incorporated in precipitable water and deposited as dry particles.

Eutrophication: the process where a lake accumulates high levels of essential plant nutrients, mostly phosphorus and nitrogen.
In highly developed areas, streams and groundwater can transport high levels of nutrients originating from fertilizers and treated/untreated sewage effluent.
This increase in the amount of nutrients induces accelerated growth of algae, which die seasonally and in the process, consume dissolved oxygen in the process of decaying.
In turn, the reduction in oxygen makes a lake or estuary uninhabitable for fish and other aquatic habitats.
Flood: occurs when a drainage basin experiences an unusually intense or prolonged water-input event and the resulting streamflow rate exceeds the channel capacity.
Floodplain Management: refers to any action intended to reduce future flood damages.
The economic benefits attributable to a proposed floodplain management plan are equal to the difference between flood damages with the plan and those without the plan
Flood-control dams: reduce peak flood discharge associated with a given exceedence probability at locations downstream from the dam.
Dikes and levees: maintain a zero level of flooding in the area behind them until they are overtopped.
Channelization: stream channel can accommodate larger discharges.
Flood proofing: construction of buildings that can accommodate flooding with minimal damage.
Removal of structures from floodplain
Flood warning: can give people time to remove or find temporary protection for property.
Floodplain zoning: limits future developments on floodplains.

Top right quadrant: This is similar to the FDC, but is instead a relationship between flood magnitude and exceedence probability that is based on existing data.
The magnitude of flood damages depends largely on the depth of flooding, so the upper left quadrant relates flood depth to flood discharge.
The lower left quadrant relates flooding depth to damages for that particular floodplain. This relationship is often based on field or aerial photographic surveys of the types and locations of the existing buildings.
The curve on the lower right quadrant relates damages to exceedence frequency and is developed based on the relationships established in the three other quadrants. Average annual damages can be calculated by determining the area under the curve of the lower right quadrant.

Most commonly, the time series that you would use for the analysis is constructed from annual series by selecting the highest instantaneous peak flow in each year of record.
Low Streamflow
low flows are defined as annual minimum flows averaged over consecutive day periods (7 days are most common).
Referred to as a dQp where p is the annual non-exceedence probability for the flow averaged over d days
Drought: dry period with a duration of at least a few months that is a significant departure from the norm.
Measuring Drought
Palmer drought severity index (PDSI): commonly used measure of agricultural drought. Uses precipitation and temperature data to compute the water balance for a climactic region on a monthly basis. The values range from -6 (extreme drought) to +6 (extreme wetness).
Drought Analysis
What type of drought is of interest?
Meteorological –precipitation
Agricultural- PDSI or soil moisture
Hydrological-streamflow, groundwater levels
What averaging period will be used?
Generally greater than 1 month, could be 3 months, 1 year
How will drought be quantitatively defined?
What is the cutoff value for a variable (e.g., precipitation, PDSI, streamflow, groundwater level) measured over a certain period that constitutes a drought?
Could use mean, median or mean minus one standard deviation
Once the cutoff is defined, you can further define drought by its duration, severity (deviation from cutoff value) or intensity (severity/duration).
What are the magnitude-frequency relations of drought characteristics
How are regional aspects of drought addressed?

Current & Projected Water Useage
Wd(t)=ud(t)*N(t)
Wd: water-use projection.
N(t) is the projected population
ud (t) is the projected per capita use.
US, uD (1995) =247 m3 person-1 y-1


